
Day 1 — Meeting the Machine: Understanding DEBUG Before Assembly#
When students first learn programming, they usually start with languages like Python, Java, or C#.
They write code like:
x = 5
y = 3
print(x + y)
The computer somehow runs it.
Most students never ask what happens underneath.
Today, we’re going to look underneath.
Not through a modern IDE.
Not through a compiler.
Not through a debugger with windows and buttons.
We’re going to talk directly to the machine.
And the tool that lets us do that is called DEBUG.
What Is DEBUG?#
The biggest misconception students have is thinking DEBUG is just a debugging program.
It is much more than that.
Think of DEBUG as a microscope for the computer.
A microscope lets a biologist see cells.
DEBUG lets us see what is happening inside memory, registers, and machine code.
Without DEBUG, the CPU is a black box.
With DEBUG, we can watch the CPU think.
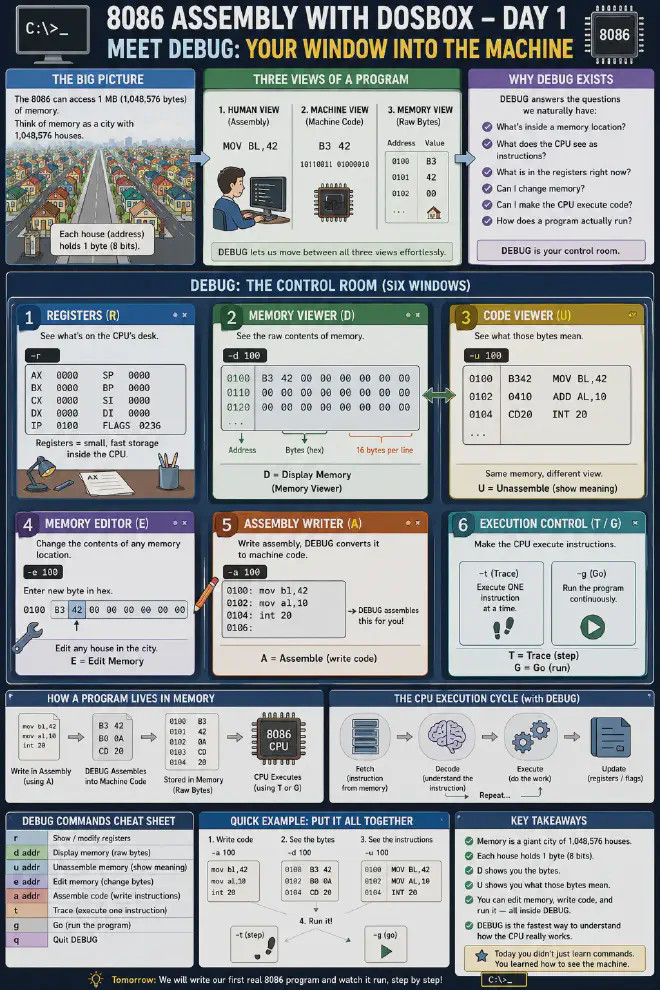
The City Analogy#
Imagine the computer’s memory is a giant city.
The Intel 8086 can access:
1,048,576 bytes
which is:
1 MB
Think of this as a city containing:
1,048,576 houses
Each house has:
- An address
- Space for exactly one byte
For example:
House 0100 contains B3
House 0101 contains 42
House 0102 contains 00
Memory is simply a giant collection of numbered houses.
Why Do We Need DEBUG?#
Imagine standing in that city.
You want to know:
- What’s inside a house?
- Which houses contain instructions?
- What is the CPU currently doing?
- Can I change what’s inside a house?
- Can I make the CPU execute something?
DEBUG answers all these questions.
Every command in DEBUG exists because of one of these needs.
DEBUG Is a Control Room#
Instead of memorizing commands, think of DEBUG as a control room with six windows.
Window 1: Registers#
Registers are tiny storage locations inside the CPU.
To view them:
-r
Example:
AX=0000
BX=0000
CX=0000
DX=0000
Think of registers as the CPU’s desk.
Memory is a huge warehouse.
Registers are the papers currently sitting on the desk.
Window 2: Memory Viewer#
Command:
-d
Many students get confused by the word “dump.”
Forget the word dump.
Think:
D = Display Memory
or
D = Memory Viewer
Example:
-d 100
Output:
0100 B3 42 00 00 00 00 ...
This means:
“Show me the contents of memory starting at address 0100.”
Nothing more.
Nothing less.
Every pair of hex digits is one byte.
Window 3: Code Viewer#
Command:
-u
Example:
-u 100
Output:
0100 B342 MOV BL,42
The important idea:
d = shows bytes
u = shows meaning
Both commands are looking at exactly the same memory.
Imagine opening a book.
One person sees ink on paper.
Another person reads the words.
Same book.
Different interpretation.
That is the difference between D and U.
Window 4: Memory Editor#
Command:
-e
Example:
-e 100
This lets us change bytes directly.
Think:
D = View Houses
E = Edit Houses
If memory is a city, E lets us walk into a house and replace what is inside.
Window 5: Assembly Writer#
Command:
-a
Example:
-a 100
Then:
mov bl,42
mov al,10
DEBUG converts these instructions into machine code automatically.
Think:
A = Assemble
or:
A = Write Instructions
This is where we begin creating programs.
Window 6: Execution Control#
Commands:
-g
and
-t
These answer the question:
“How do I make the CPU run?”
G = Go#
Runs the program.
-g
Think:
GO
T = Trace#
Runs one instruction at a time.
-t
Think:
Take one step.
This is one of the most powerful learning tools in DEBUG.
You can literally watch the CPU execute instructions one by one.
The Three Views of a Program#
By the end of today, you should understand that a program can be viewed in three different ways.
Human View#
MOV BL,42
Readable.
Easy for humans.
Machine View#
B3 42
Readable by the CPU.
Memory View#
Address   Value

0100      B3
0101      42
Where the bytes are physically stored.
DEBUG lets us move freely between all three views.
This is why it is such a powerful learning tool.
The Mental Model That Makes Everything Click#
Forget the commands for a moment.
Imagine DEBUG as a room with six buttons:
R = What's on the CPU's desk?
D = What's inside memory?
U = What do these bytes mean?
E = Change memory
A = Write code
G = Run code
Suddenly the commands are no longer random.
Each one answers a question you naturally have about the machine.
What We Learned Today#
We did not learn assembly language yet.
We learned something more important.
We learned how to observe the machine.
DEBUG is not merely a debugger.
It is a window into the world beneath modern programming languages.
Before we can write assembly, we must learn how to see memory, instructions, and registers.
Today we opened that window.
In the next lesson, we will write our first real 8086 program and watch the CPU execute it instruction by instruction.